I think I have managed it! The previous post for those that are interested is here:
http://langster1980.blogspot.co.uk/2017/05/making-venturi-tube.html
I had been researching Python scripting and whilst this is possible I don't have the time, patience or inclination to learn another programming language - there is only so much room in my head for information! Perhaps I will learn Python in the future and being aware of it and it's function will probably serve me well.
I was browsing through you tube and google looking for programs which graph serial data automatically from comma separated values. I specifically made sure that the data sent out to the serial port from the arduino was comma separated...it makes it easy to import into a spreadsheet program and graph. I would like to be able to do that real time as well.
In my searching I found this video:
https://youtu.be/yYyW16FYqE0
It describes a java applet which has been written to graph serial data directly from the arduino - just what I was looking for! The video itself explains how to use it quite simply so I won't bother. Sufficed to say all one needs to do is select the appropriate COM port and baud rate and then complete the form with the required information and units and the graph will be displayed.
The java applet can be downloaded from here:
http://farrellf.com/TelemetryViewer/T...
If you haven't got Java installed that will be needed also:
https://java.com/en/download/
Once everything is installed I would watch the video and learn how to use the applet. The help button is quite useful! Here are the results:
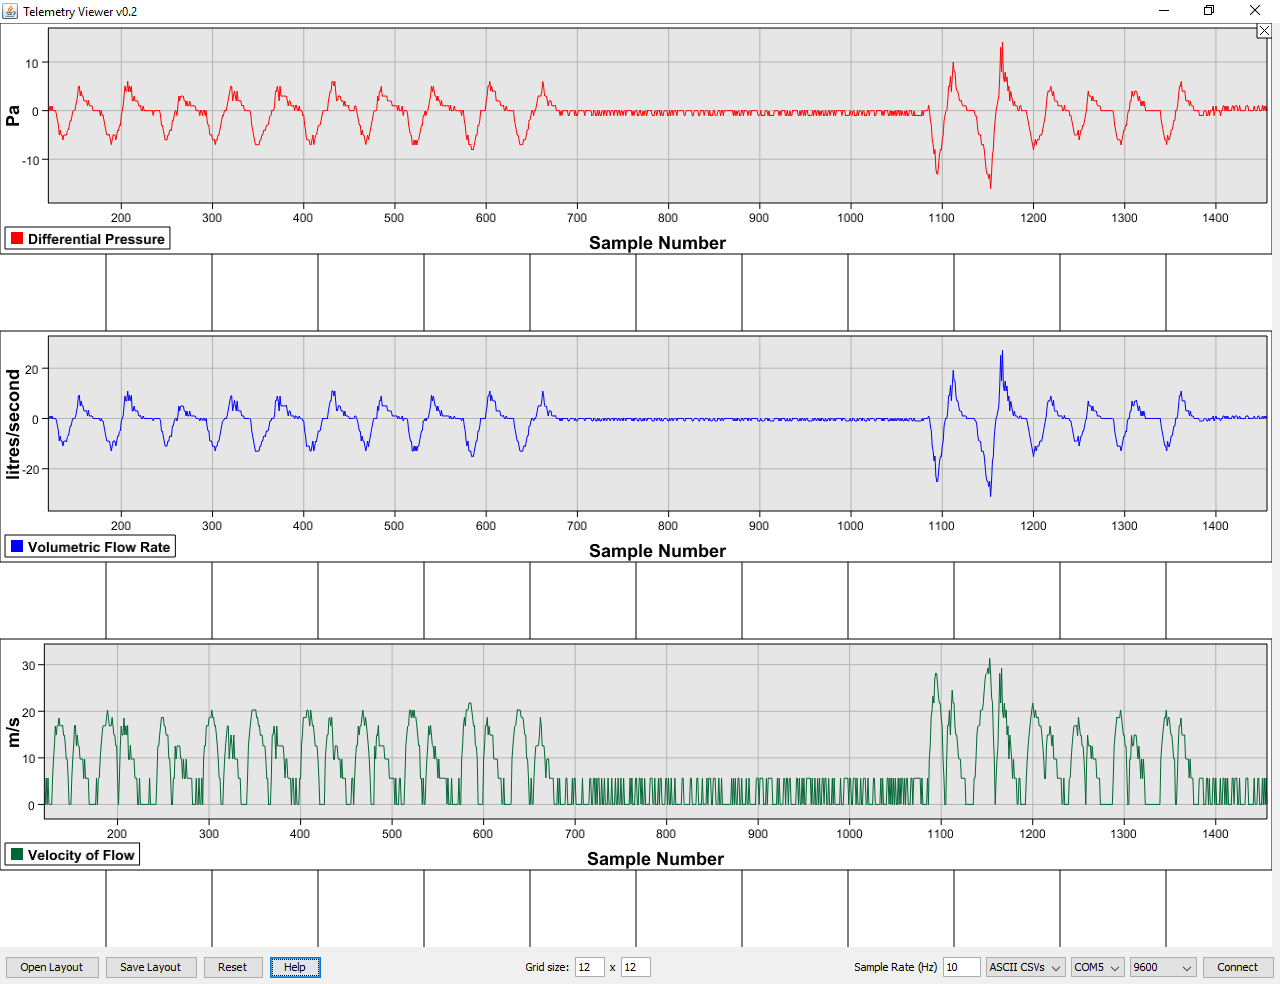
Here is another screenshot:

Which is very close to the example image given when this project was first specified:
As this part of the project is almost complete, I'm going to move on to the next section which was to measure the pressure output from the ventilator using one of my pressure sensor breakout boards - not too hard to add hopefully. After that it's develop a EMG measurement circuit.
Along the way I think it might be useful to add a microSD card to log the data received along with a real time clock and finally use bluetooth communications to provide wireless serial communications. It's also time to consider powering the system - I'm looking at using 18650 lithium cells and a suitable charging circuit with protection. After than design an enclosure and add some LEDS to show function and this project can be marked complete! Not too far now!!!!
Take care always - Langster!
No comments :
Post a Comment